
 interesting visual look at the # of teachers needed to meet goal of universal primary education
Tag Archives: Infographic
Infographic on Global Teacher Shortage: 6 of 10 new posts are needed in Sub-Saharan Africa
Filed under Uncategorized
Interactive Infographic: Student Debt in America
September 5, 2012 • 10:30 am PDT(function(d, s, id) { var js, fjs = d.getElementsByTagName(s)[0]; if (d.getElementById(id)) {return;} js = d.createElement(s); js.id = id; js.src = “//connect.facebook.net/en_US/all.js#appId=100709553371867&xfbml=1”; fjs.parentNode.insertBefore(js, fjs);}(document, ‘script’, ‘facebook-jssdk’));
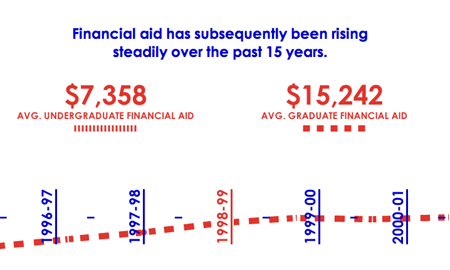
This infographic is a collaboration between GOOD and Other Means, with support from MTV
As the election season kicks off, GOOD and MTV want to cut past all the blustering, pontificating, and finger pointing to get to the heart of some of the most important issues that America is facing today. Join us every other Wednesday for the next two months, when we’ll be graphically exploring through interactive infographics what goes behind the nation’s key issues.
Last time, we looked at energy independence and job creation. This week’s issue explores a pressing problem for students and their families: the rising cost of college tuition. Studies show that a bachelor’s degree can have a big impact on long term job prospects, but can students afford the price tag for a degree? How much money are students spending on their postsecondary degrees and is this financial investment paying off? Find the answers and more here.
Filed under E-learning Dragon training.
